Imagine opening a research story and seeing a curve that slopes downward. One explanation seems immediately plausible: whatever generated the measurements must have diminished. But consider a different possibility. The underlying quantity could have stayed constant while the method of recording it changed. Both stories might produce an identical picture. Choosing between them requires information the picture does not contain. The useful question is therefore more specific than whether the curve looks convincing: what additional observation would make the competing explanations predict different results? That question turns an attractive visual pattern into a problem that a comparison could help resolve.
This article begins with a compact account of a published observation, then develops an explicitly invented measurement problem. The invented scores have no clinical units and represent no people or trial reconstruction. They allow us to distinguish an observation from an explanation and an explanation from a proposed test. We will examine when events occur, how recording choices enter a graph, and how a future comparison could challenge an interpretation. These are separate tasks. Describing a pattern accurately is valuable even when the information needed to choose its explanation remains unavailable; proposing a useful test does not mean that test has already been performed.
Reading notes
- Separate the clocks
- Observation, publication and revision dates identify different events in a research story.
- Preserve event order
- A final flag can discard the sequence needed to examine an explanation.
- Test the recording rule
- Identical recorded values can arise from different combinations of signal and measurement.
- Make alternatives distinguishable
- A useful comparison asks where competing explanations would predict different observations.
- Name the missing information
- More precise values cannot replace an independent check of an untested assumption.
What the report actually contributes
Start with a simple chain of reasoning: a question leads to observations, and those observations constrain possible explanations. Each arrow needs justification. A descriptive question might ask how a recorded quantity varies over time. An explanatory question asks which change produced that variation. An observation can answer the first question while leaving several answers to the second open. The headline-reading guide provides a place to continue that distinction. Here, the central task is to identify what a graph records before deciding what its shape means.
A useful explanation must do more than accommodate the picture after it is drawn. It should specify conditions under which a different picture would appear. If every possible result could be described as consistent with the explanation, the observation has little ability to distinguish it from alternatives. The compact research account below establishes the empirical starting point; the constructed reasoning that follows asks a separate methodological question.
January 2022 issue: exploratory pooled STEP 1–3 analyses found digestive events clustered around dose escalation during 68-week trials of weekly subcutaneous semaglutide targeting 2.4 mg versus placebo in adults with overweight/obesity, including type-2 diabetes. Timing cannot establish mechanism. Novo Nordisk funded trials; three authors were employee shareholders.
Sources: 1
Three clocks behind a research story
A research story can involve several clocks without any contradiction. An observation clock marks when information was collected. A publication clock marks when an analysis became available. A guidance clock marks the revision of advice. These clocks describe different events, so moving one forward does not automatically move the others. Suppose, entirely hypothetically, that an analyst returns to an existing set of measurements with a question about their ordering. Publishing that analysis would add a new examination of the records. It would not, by itself, establish that additional measurements had been collected.
The conceptual table separates these tasks so that a date cannot quietly stand in for the wrong event. To evaluate the hypothetical later analysis, we would ask which question had changed, which records were reused, and whether the existing recording schedule could answer it. A question requiring closely spaced measurements cannot recover those measurements merely by being asked later. Conversely, existing records might contain useful information that an earlier question did not require. The guide to reading a study record offers another way to examine how a stated research question relates to the information intended to address it.
A date alone also cannot show whether a question preceded the analysis. In the hypothetical archive example, a question chosen after inspecting the records would have a different relationship to those records from a question specified beforehand. Both can be described clearly. The important distinction is whether the same observations helped choose the question and then appeared to answer it.
| Clock | What it timestamps | What it cannot establish |
|---|---|---|
| Observation | When measurements were collected | Why a pattern occurred |
| Publication | When an analysis was reported | When participants were enrolled |
| Guidance | When advice was revised | Whether an older explanation was proven |
A sequence is more informative than a final label
Consider two invented logs from an abstract recording device. In log A, a switch is moved and the output changes afterward. In log B, the output changes before the switch is moved. Both logs could end with identical flags saying that a switch movement and an output change occurred. A final flag preserves their occurrence but discards their order. If the proposed explanation is that moving the switch produced the already recorded change, the second log challenges that explanation in a way the first does not. The same end label therefore need not describe the same explanatory situation.
Now imagine that both events were recorded only as occurring between inspections. Their precise order might remain unknown even if the inspections themselves were accurately dated. Assigning both events to the date of the next inspection would describe their discovery, not necessarily their occurrence. A useful log would distinguish an event time from a recording time and preserve uncertainty where only an interval is known. This is a logical requirement of the invented switch example, not a description of anyone's research procedures. It shows why an explanatory question may demand information that a summary flag was never designed to retain.
A falling curve has more than one explanation
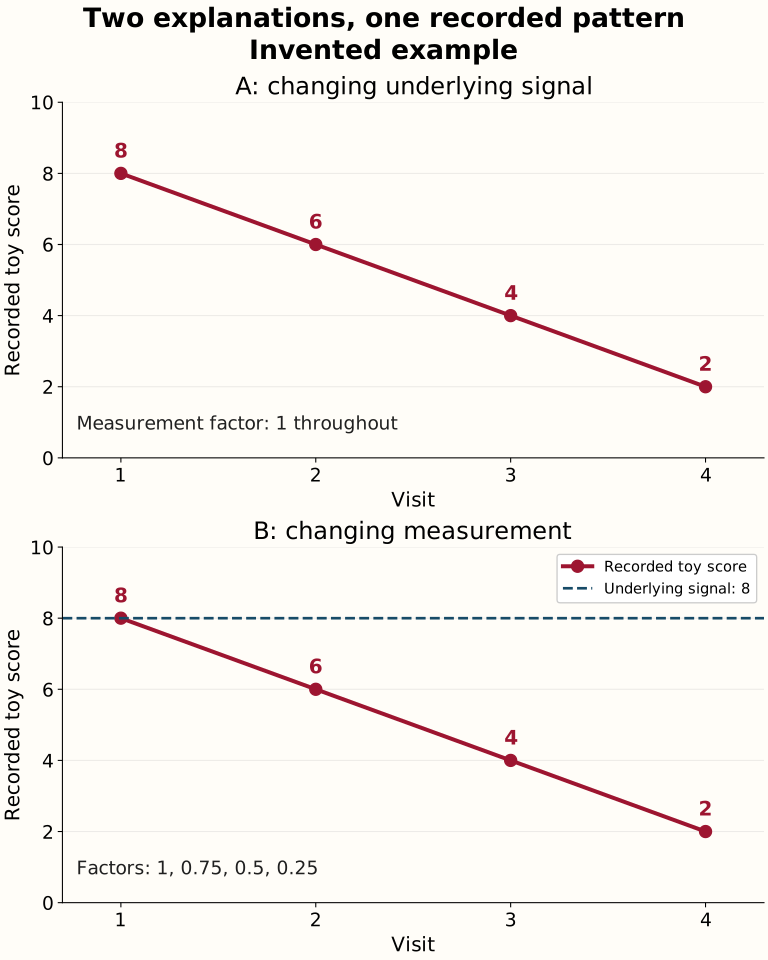
The accompanying diagram uses an invented score to make the ambiguity explicit. In panel A, the underlying signal takes the values 8, 6, 4 and 2 across four visits. A fixed measurement factor of 1 leaves each value unchanged. Multiplying the signal by that factor produces the recorded sequence. In this construction, the declining record accurately follows a declining underlying quantity because the recording factor has been held constant by definition.
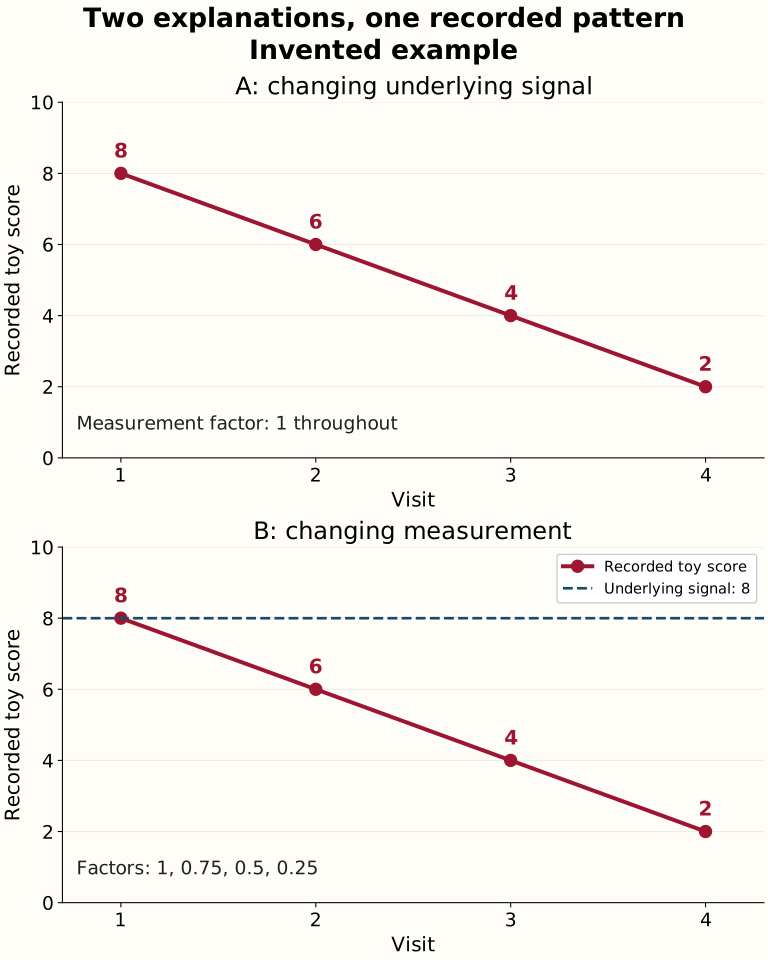
Panel B begins with a different construction. The underlying signal stays at 8, while the measurement factor changes from 1 to 0.75, then 0.5 and finally 0.25. The products are 8, 6, 4 and 2. The record is identical to panel A even though the underlying signal never changes in panel B. Multiplication describes the invented recording rule; neither its factors nor its scores estimate a clinical process.
If we covered the panel labels and retained only the recorded points, the diagram would not tell us which construction generated them. That is the precise ambiguity the example demonstrates. It does not establish that measurement changed in any real investigation, nor suggest misconduct. An independent check of the measurement factor would supply information missing from the recorded curve. The drawing identifies that missing information without pretending to provide it.
Scroll the diagram horizontally on smaller screens. The full-size diagram and its data are available below.
Download diagram (SVG)Download hypothetical data (CSV)
| Visit | Recorded toy score | Measurement factor |
|---|---|---|
| 1 | 8 | 1 |
| 2 | 6 | 0.75 |
| 3 | 4 | 0.5 |
| 4 | 2 | 0.25 |
Write the competing explanations before choosing one
Competing explanations become useful when they make different predictions. In the invented score example, an underlying-change explanation predicts that a separate, stable measurement of the same quantity would also change. A measurement-change explanation instead directs attention to the recording factor. A concurrent-influence explanation introduces another changing condition and must explain what would happen when that condition remained fixed. These are proposed constructions, not established mechanisms. The table pairs each with an observation that could challenge it. Its purpose is to make the alternatives distinguishable rather than merely give the same curve several different names.
Observation opportunities deserve their own question. Suppose a hypothetical recording system accepts input only during selected intervals. If those intervals changed, its record might change even without a change in the process outside them. Testing that possibility would require information about the periods when recording was possible, not just the values that were recorded. This differs from changing the scale of every reading, as in panel B. Specifying the distinction matters: checking calibration would not necessarily reveal missing observation opportunities. Each proposed explanation creates a particular information requirement, and a useful comparison must meet that requirement.
| Proposed explanation | Extra observation | Potential challenge |
|---|---|---|
| Underlying change | Measure the underlying quantity consistently | Stable quantity despite a changed record |
| Measurement change | Check identical recording rules | Pattern persists under stable measurement |
| Concurrent influence | Track another changing factor | Pattern persists when that influence is absent |
The comparison that would be informative
An informative hypothetical comparison would record the signal and a calibration reference on a common schedule. The reference would need a known, stable value under the conditions of the exercise. If the recording system altered both readings in a predictable way, that would support investigating the measurement process. If the reference remained stable while the signal changed, a simple common scaling explanation would face a challenge. Neither result would settle every possible explanation. The comparison would address the specific possibility it was designed to distinguish, provided the reference genuinely shared the relevant recording conditions.
Looking only at earlier and later readings would leave any simultaneous changes bundled together. To separate them, the comparison needs a reason that a selected alternative would behave differently across its conditions. That reason must be stated before interpreting the result; otherwise a convenient difference could be mistaken for the intended test. Consistent recording and a suitable reference have complementary roles: one defines the observations, while the other helps interpret a contrast. Our companion explanation-testing exercise develops the broader question of how a proposed explanation can be made vulnerable to contrary evidence.
The reference must also share the feature being tested. A reference measured through a separate recording pipeline could remain stable while the signal's pipeline changed. Its stability would then fail to test the proposed common factor. Designing the comparison means identifying that shared feature, not simply placing another line beside the original one.
Align the measurement with the proposed explanation
The choice of a time origin should follow the question being asked. In the invented device example, time since installation would answer a different question from time since a switch movement. Aligning records to installation could place the proposed explanatory event at different positions in different logs. Aligning them to the switch would make that event the common reference, but would not erase differences in what occurred beforehand. Neither alignment is automatically correct. The analyst needs to explain which relationship the chosen origin makes visible and which relationships it leaves outside the display.
The outcome window needs the same care. A switch moved after a recording interval has closed cannot explain a change already completed within that interval. Moving the window afterward to include a convenient event would change the question rather than repair the original ordering. A prospective plan could specify the reference event, the interval to be examined, and how ambiguous timestamps will be handled. The explanation of how estimates are defined extends this attention to the question represented by a reported result. Logical ordering removes incompatible accounts; it does not identify every remaining cause.
Alignment also determines which invented device logs contribute to each comparison. Suppose two devices retain constant underlying signals of eight and two, both recorded with a measurement factor of one. In an early window, both are included, giving an average recorded score of five. In a later window, the first device has no eligible reading and only the second contributes, giving an average of two. The average falls although neither device changes its signal or recording factor. This changes the composition of the comparison, separate from either construction in the diagram. Restricting both windows to the second device would produce a constant score of two, but answer a narrower question about that device alone. Keeping both devices as the target instead requires acknowledging that their later average is unavailable from these readings. An audit should track eligibility across aligned windows, asking which logs contribute to each plotted value and whether that set stays the same.
Information a timing graph leaves out
A timing graph shows selected information about records, not the entire process that produced them. In our invented example, the plotted values alone do not reveal whether the scale was held constant, whether every planned reading was obtained, or whether recording opportunities were comparable. A missing reading is different from a recorded zero. Joining points across a gap would draw a continuous line, but the connection would be a graphical choice rather than an observation from inside the gap. To interpret that portion of the picture, the reader would need the missingness rule and the observation schedule.
Uncertainty also concerns what a quantity means. Error bars around the toy scores, if someone chose to add them, would not by themselves identify whether the underlying signal or measurement factor had changed. Greater precision about a product does not uniquely determine its separate factors. The problem is structural: different combinations can produce the same result. A careful explanation therefore distinguishes uncertainty about the recorded value from uncertainty about its interpretation. Resolving the latter could require a different kind of observation, even if the existing values were measured with perfect precision under the invented rule.
A constraint can sometimes narrow an interpretation without identifying an exact explanation. For another invented exercise, suppose independent information guarantees that the measurement factor stays between one half and one throughout. A recorded score of eight then permits underlying signals from eight to sixteen; a recorded score of two permits signals from two to four. These ranges do not overlap. Under the stipulated constraint, the underlying signal must therefore be lower at the later reading, even though its exact values remain unknown. That conclusion would change if the allowed factor extended down to one quarter. The first range would become eight to thirty two, and the second two to eight, allowing a constant underlying signal of eight. The inference depends on how strongly the separate information constrains measurement. Reporting the permitted ranges exposes that dependence directly, distinguishing an ordering supported by stated assumptions from a numerical change or causal explanation that those assumptions cannot identify.
What would change the interpretation
A future test of the toy problem could begin by writing the competing predictions before collecting the new records. Under a simple common measurement-factor explanation, a stable reference observed through that same factor would change in a specified relation to the signal record. Under a changing-signal explanation with stable measurement, it would not. The test would need a reference suitable for that contrast, a consistent schedule, and an agreed way to classify departures from the predictions. These are design requirements for an abstract exercise, not instructions for anyone to experiment with treatment.
Repeating the downward pattern would confirm that a similar record could be obtained again. Repeating the explanatory test would ask something more demanding: whether the information that distinguished the alternatives also recurred. An unexpected reference pattern might undermine the assumed calibration rule instead of favoring either initial explanation. That possibility should remain available in the interpretation. A useful test need not force a winner. It can reveal that the original alternatives were incomplete, identify the assumption that failed, and make the next comparison more specific without turning an unresolved result into an endorsement.
Before seeing the new record, the hypothetical analyst could describe which reference behavior would count against each explanation and which behavior would remain inconclusive. That commitment creates a useful distinction between a surprising observation and a rewritten prediction. If the interpretation changes afterward, the changed assumption should be identifiable rather than absorbed invisibly into the original story.
Bring the scientific question back to the headline
Return to the invented curve and consider what a responsible headline could promise. It could identify the recorded change and the comparison needed to distinguish its possible origins. It should leave that distinction visible instead of converting a plausible account into a settled explanation. This reading discipline also keeps a scientific question separate from the terms of a service offer. For documentary context, one provider review and another provider review can serve as places to locate dated terms and questions. Those links supply no additional evidence about the abstract measurement problem developed here.
The toy exercise ends with a question about evidence, not a personal management plan. Clinical questions belong with a qualified clinician. The following compact safety note is separate from the hypothetical reasoning; its terminal date identifies the label revision, rather than the publication date of the research account: Wegovy delays gastric emptying; severe or persistent gastrointestinal symptoms need clinician assessment. Severe gastroparesis: not recommended. Dehydration can injure kidneys. June 2026. Compounded medicines are not FDA-approved.
Questions about the analysis
Does a later publication mean the experiment is new?
Not necessarily. Imagine an analyst publishing a new examination of measurements already stored in an archive. The publication would be new, while the observations would retain their original timing. The useful distinction is whether additional records were collected, an additional question was asked, or both. Each possibility gives the publication a different relationship to the underlying evidence.
Can an early pattern reveal a cause?
In the invented switch example, knowing which event came first can exclude an explanation that requires the reverse order. It does not select a unique explanation from everything compatible with that order. A useful next question is what each remaining possibility predicts under a comparison designed to make their predictions differ.
Why build two explanations for the same curve?
The invented arithmetic exposes information that the plotted result lacks. A recorded score of 4 could come from a signal of 4 with factor 1, or a signal of 8 with factor 0.5. Showing both constructions makes clear why an independent measurement check would be useful; choosing one construction would otherwise hide an assumption.
Would more measurements settle the question?
More closely spaced observations could clarify ordering or reveal gaps in the record. But repeated measurements made through the same unidentified factor would still leave the toy example ambiguous. The needed improvement depends on the question: finer timing could help locate a change, while an independent reference could help distinguish a signal change from a recording change.
How should a headline describe uncertainty?
A useful headline identifies the observation and leaves room for the comparison that could distinguish its explanations. For the invented example, the missing information concerns the recording factor, not merely confidence in the plotted values. Naming that gap gives the reader a concrete question to pursue without implying that the favored explanation has already survived a test.
Editorial assessment
For the invented problem, the strongest next comparison would add information that the existing curve cannot supply. A suitable reference measured alongside the signal could test a specific account of the recording process, provided the reference and its assumptions were justified. More elaborate descriptions of the same points would not perform that work. The editorial standard is therefore whether an explanation yields a distinguishable prediction and whether the proposed observation can fairly examine it. A result might weaken an explanation, expose a failed assumption, or leave several possibilities open. Each can advance the question when its meaning is stated precisely. The value of the exercise lies in designing a discriminating comparison, not in declaring that an appealing account must be correct.
Source documents
- Wharton 2022 · Checked 2026-10-27
- WEGOVY NLM · Checked 2026-10-27
- FDA GLP-1 FDA · Checked 2026-10-27